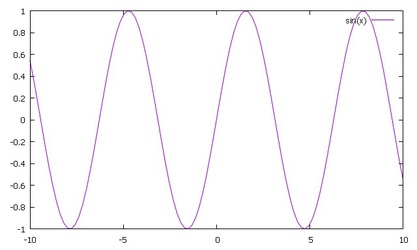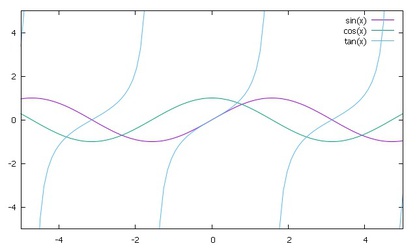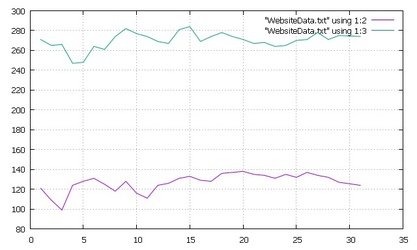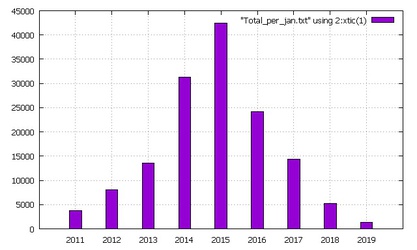
Gnuplot is a free, open-source and cross-platform graphing utility capable of drawing 2D, 3D, histograms and many other types of graphs. Gnuplot is used by other projects as a graphing engine.
- The good
- Free and open-source.
- Ability to plot different types of graphs.
- Used as a plotting engine for many open-source projects.
- The bad
- Not very intuitive for a beginner.


What is Gnuplot?
Gnuplot is used mainly to represent data in a graphical format, the data can be read from a file or plotted from a mathematical expression.
Gnuplot finds applications in various fields such as data visualizing in data science, teaching mathematics, academia, and other areas of science and engineering.
Due to the free Gnuplot license, it has been included as an engine to generate plots and graphical representation in many scientific software projects such as Maxima, GNU Octave, and others, in addition to being able to interact with it directly from multiple programming languages such as Python, C, C ++, and SageMath.
Install Gnuplot on Windows
The first step is to download a precompiled version of the program for the operating system you are working on, and although thesource code of the program is open source and therefore it probably can be compiled on the operating system you are working on, it is best to get a previously compiled version to save effort and time.
To obtain a compiled version of the program for the Windows operating system, you can download it directly from Downzen by clicking the download button on this page or by visiting the Gnuplot's download page on SourceForge.
The steps for installing the program are the same as the usual steps in most other Windows programs, but make sure in the last step to select the checkbox on "Add application directory to your PATH environment variable" option so that you can run the program from the PowerShell or the command line (cmd), as shown in the image below. Even though Gnuplot has a graphical interface (GUI) of its own and therefore you do not have to use it from the command line or power shell.
Examples
Gnuplot website offers a large set of demo plots to demonstrate its use, you can easily use them to learn how to use the software in addition to complete documentation. Below are some examples taken from the demo page.
Simple plot
set title "Simple Plots" font ",20"set key left boxset samples 50set style data pointsplot [-10:10] sin(x),atan(x),cos(atan(x))
Bar graphs
set title "Clustered bar graph with individual colors\nspecified via plotstyle 'boxes'"set title boxed offset 0,-3 font ",15"set style fill solid border lt -1set style textbox opaque noborderset boxwidth 1.0 absClusterSize = 15unset keyset yrange [0:7]set xrange [-2:60]set border 0category = "Yan Tan Tethera Methera Pimp"set xtics scale 0 ()set ytics scale 0 nomirrorset grid yset colorb horizontal user origin .05, .05 size .9, .05set palette cubehelixset bmargin at screen 0.2set tmargin at screen 0.9set for [i=1:4] xtics add (word(category,i) 5+(i-1)*ClusterSize)xcoord(i) = i*ClusterSize + column(1)color(i) = rand(0)plot for [i=0:3] 'candlesticks.dat' \ using (xcoord(i)):(column(i+2)):(color(i)) with boxes lc palette z
3D plots
unset arrowunset labelset gridsplot x**2+y**2, x**2-y**2
Download Gnuplot for Windows
To get the latest version of Gnuplot 5.4.3 with a direct and fast download link via Downzen click on the download button on this page.
Additional information
- Version5.4.3
- Last update2019-01-07
- Downloads827
- LicenseFree
- Size36.7MB
- RequiresWindows 2000,Windows 2012,Windows 10,Windows 98,Windows 8,Windows 7,Windows 2003,Windows 2008,Windows Vista,Windows XP
